Smelter
2023-2024, Product Design
Yandex is an IT giant that unites a huge set of different teams and companies. Currently, about 20 thousand people work at Yandex. I work in the international projects department at the B2B startup Smelter.
Smelter is an AI-powered social listening tool designed to optimize marketing operations. We collect mentions of customer queries on social networks and the Internet, provide the necessary analytics, and supplement them with a predictor.
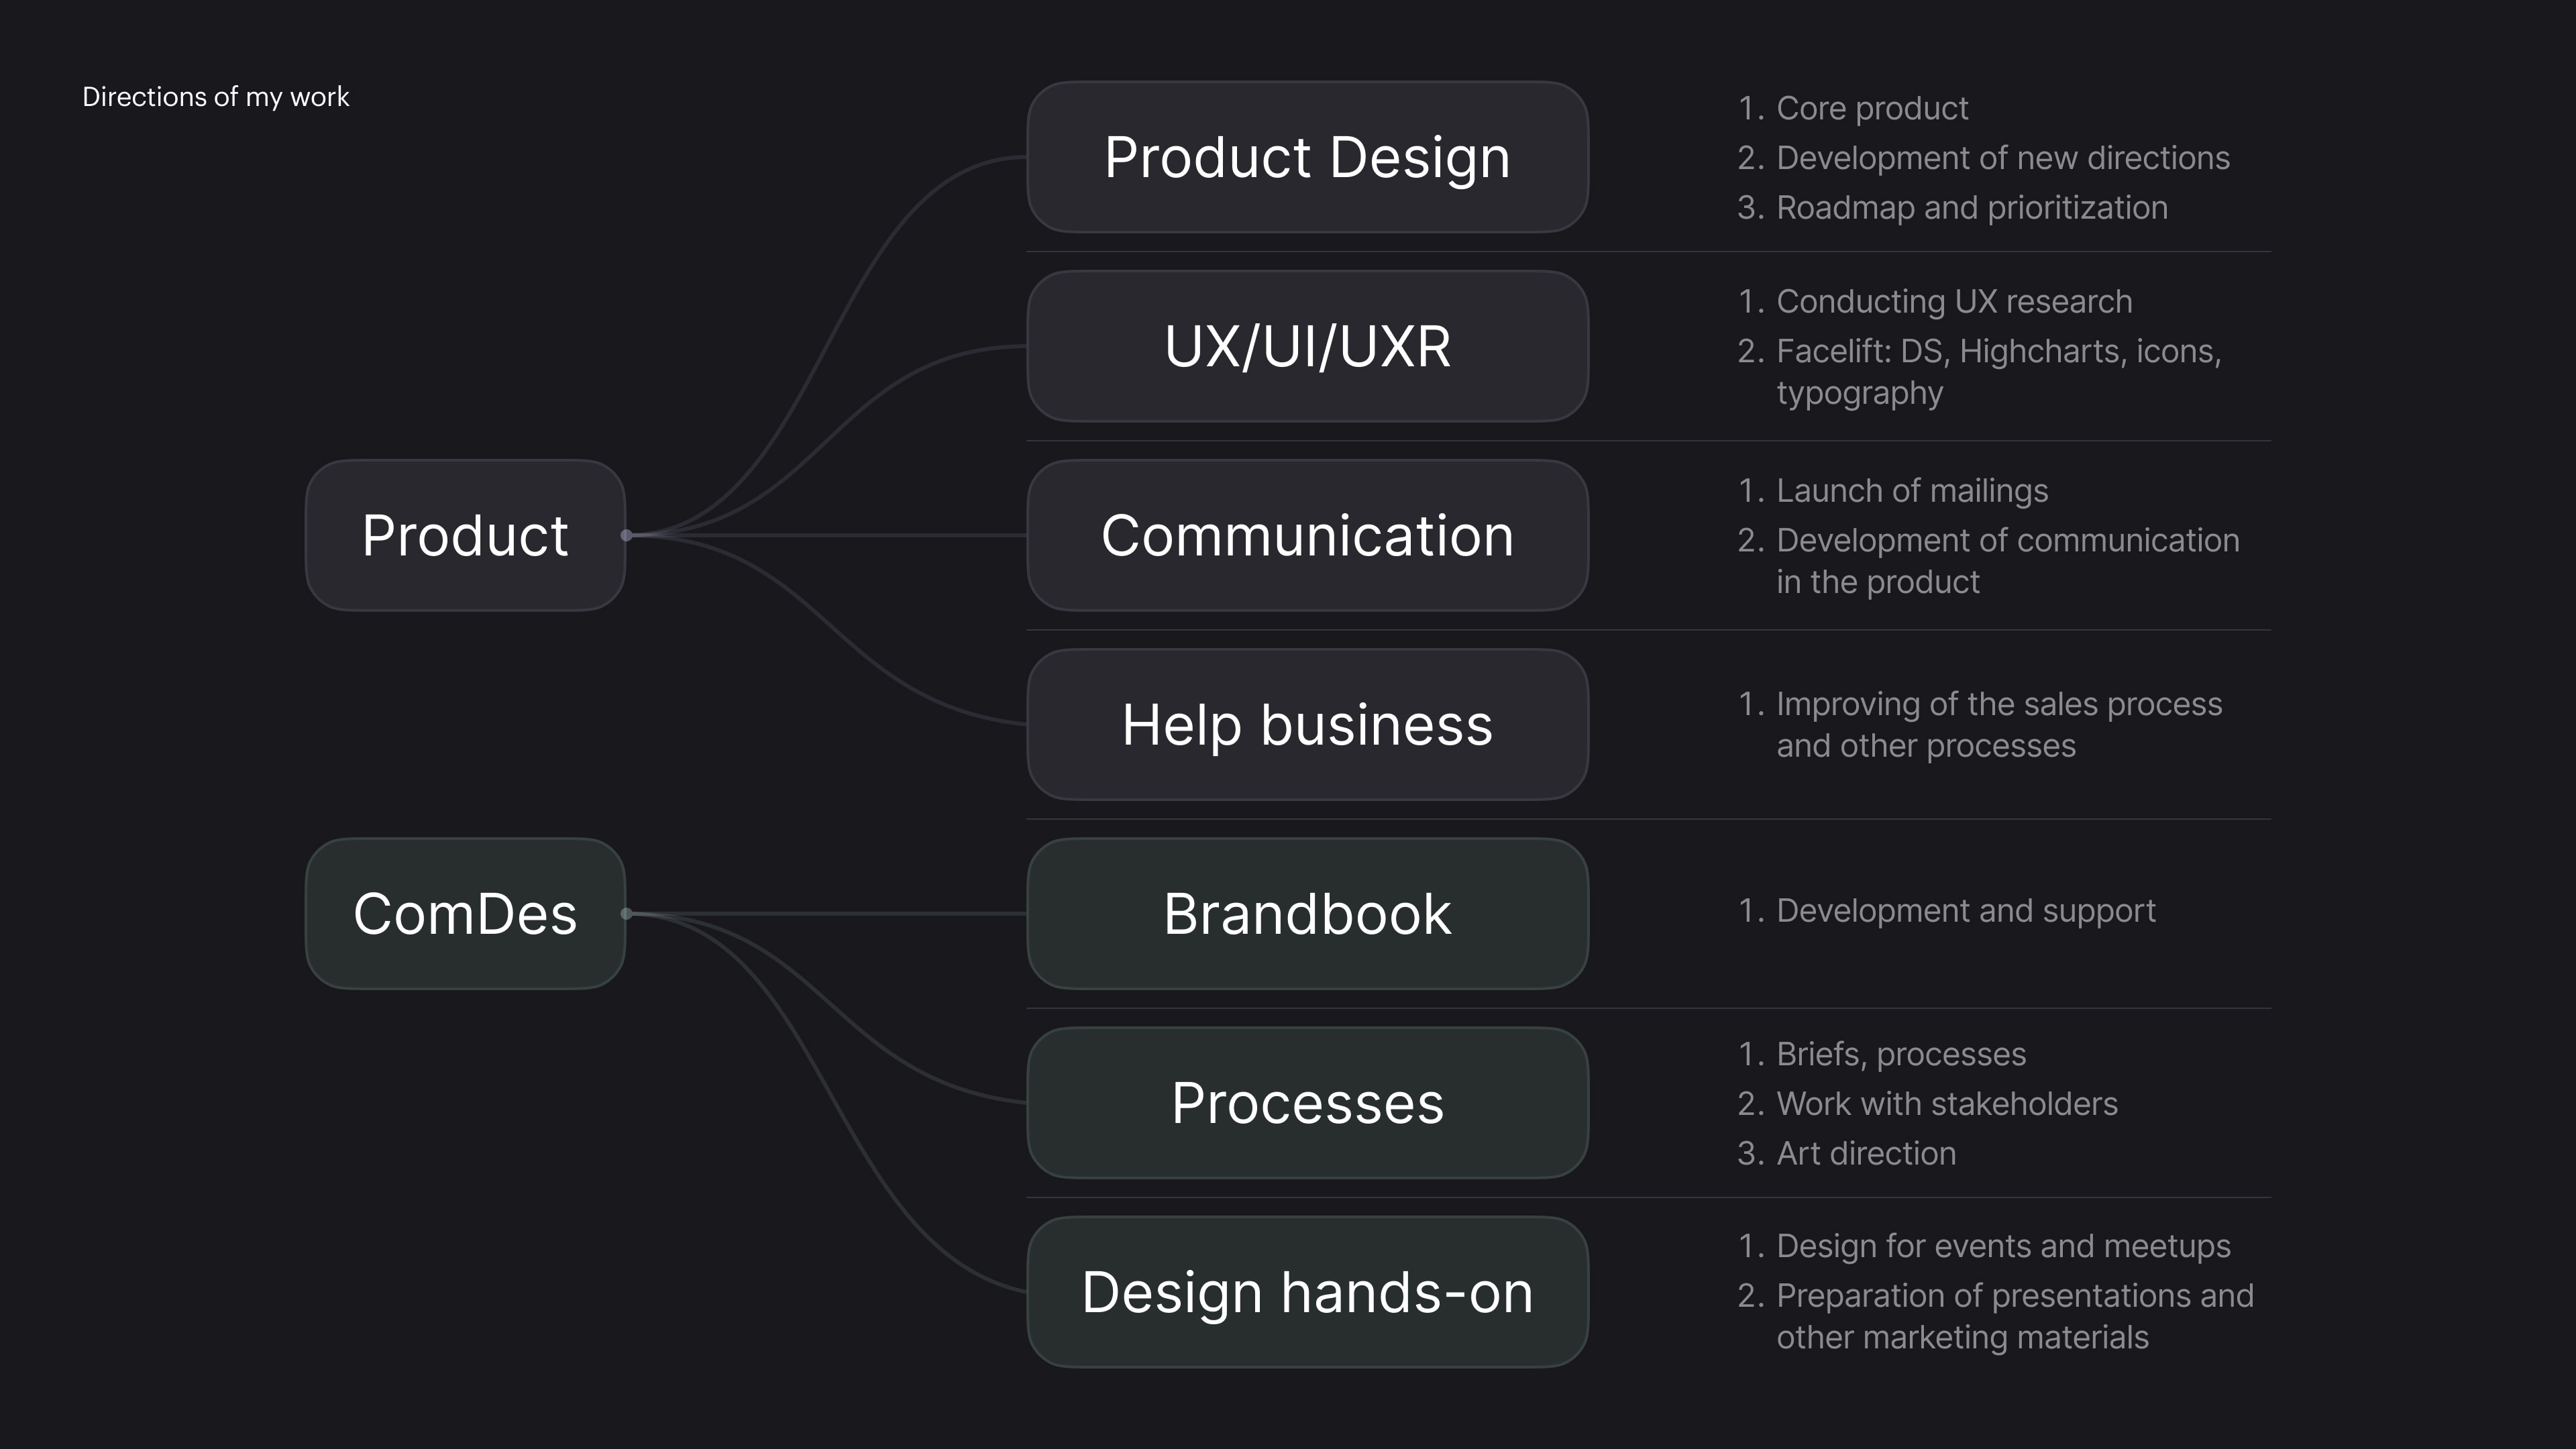
I'm a solo designer at a startup with a multidisciplinary role.
Intro
How we work
In the product, I try to use tactics of small but significant improvements. At the same time, I formulate a general strategy for improving UX, UI, and design systematization.
In parallel to making small, tactical improvements, I am also working on large projects: personalized dashboards, developing AI in the product, improving processes, and trying to implement UX research into the product flow.
We only make the web without adaptive to speed up production and testing hypotheses. In the original, we used Ant Design and Highcharts almost unchanged, but in this case, I show the improved UI that we want to achieve in the future.
I want to talk about some cases done over 9 months of work. Because we avoided lengthy projects and moved as quickly as possible, we decomposed large projects and identified critical parts of the functionality to quickly deliver value to users. Conventionally: do 20% to achieve 80% efficiency.
The cases below are a set of such small formulated business or user problems that led to solutions. We did the tasks at different times, but I combined them logically to show the development of the platform in key areas.
Case. I
Analytics and Comparison
Analytics and comparison are the main sections where customers get information about mentions of their brand/product and competitors' brands/products. Therefore, we gradually developed these sections, delivering more value to customers and giving them more decision-making tools.
Problem 1
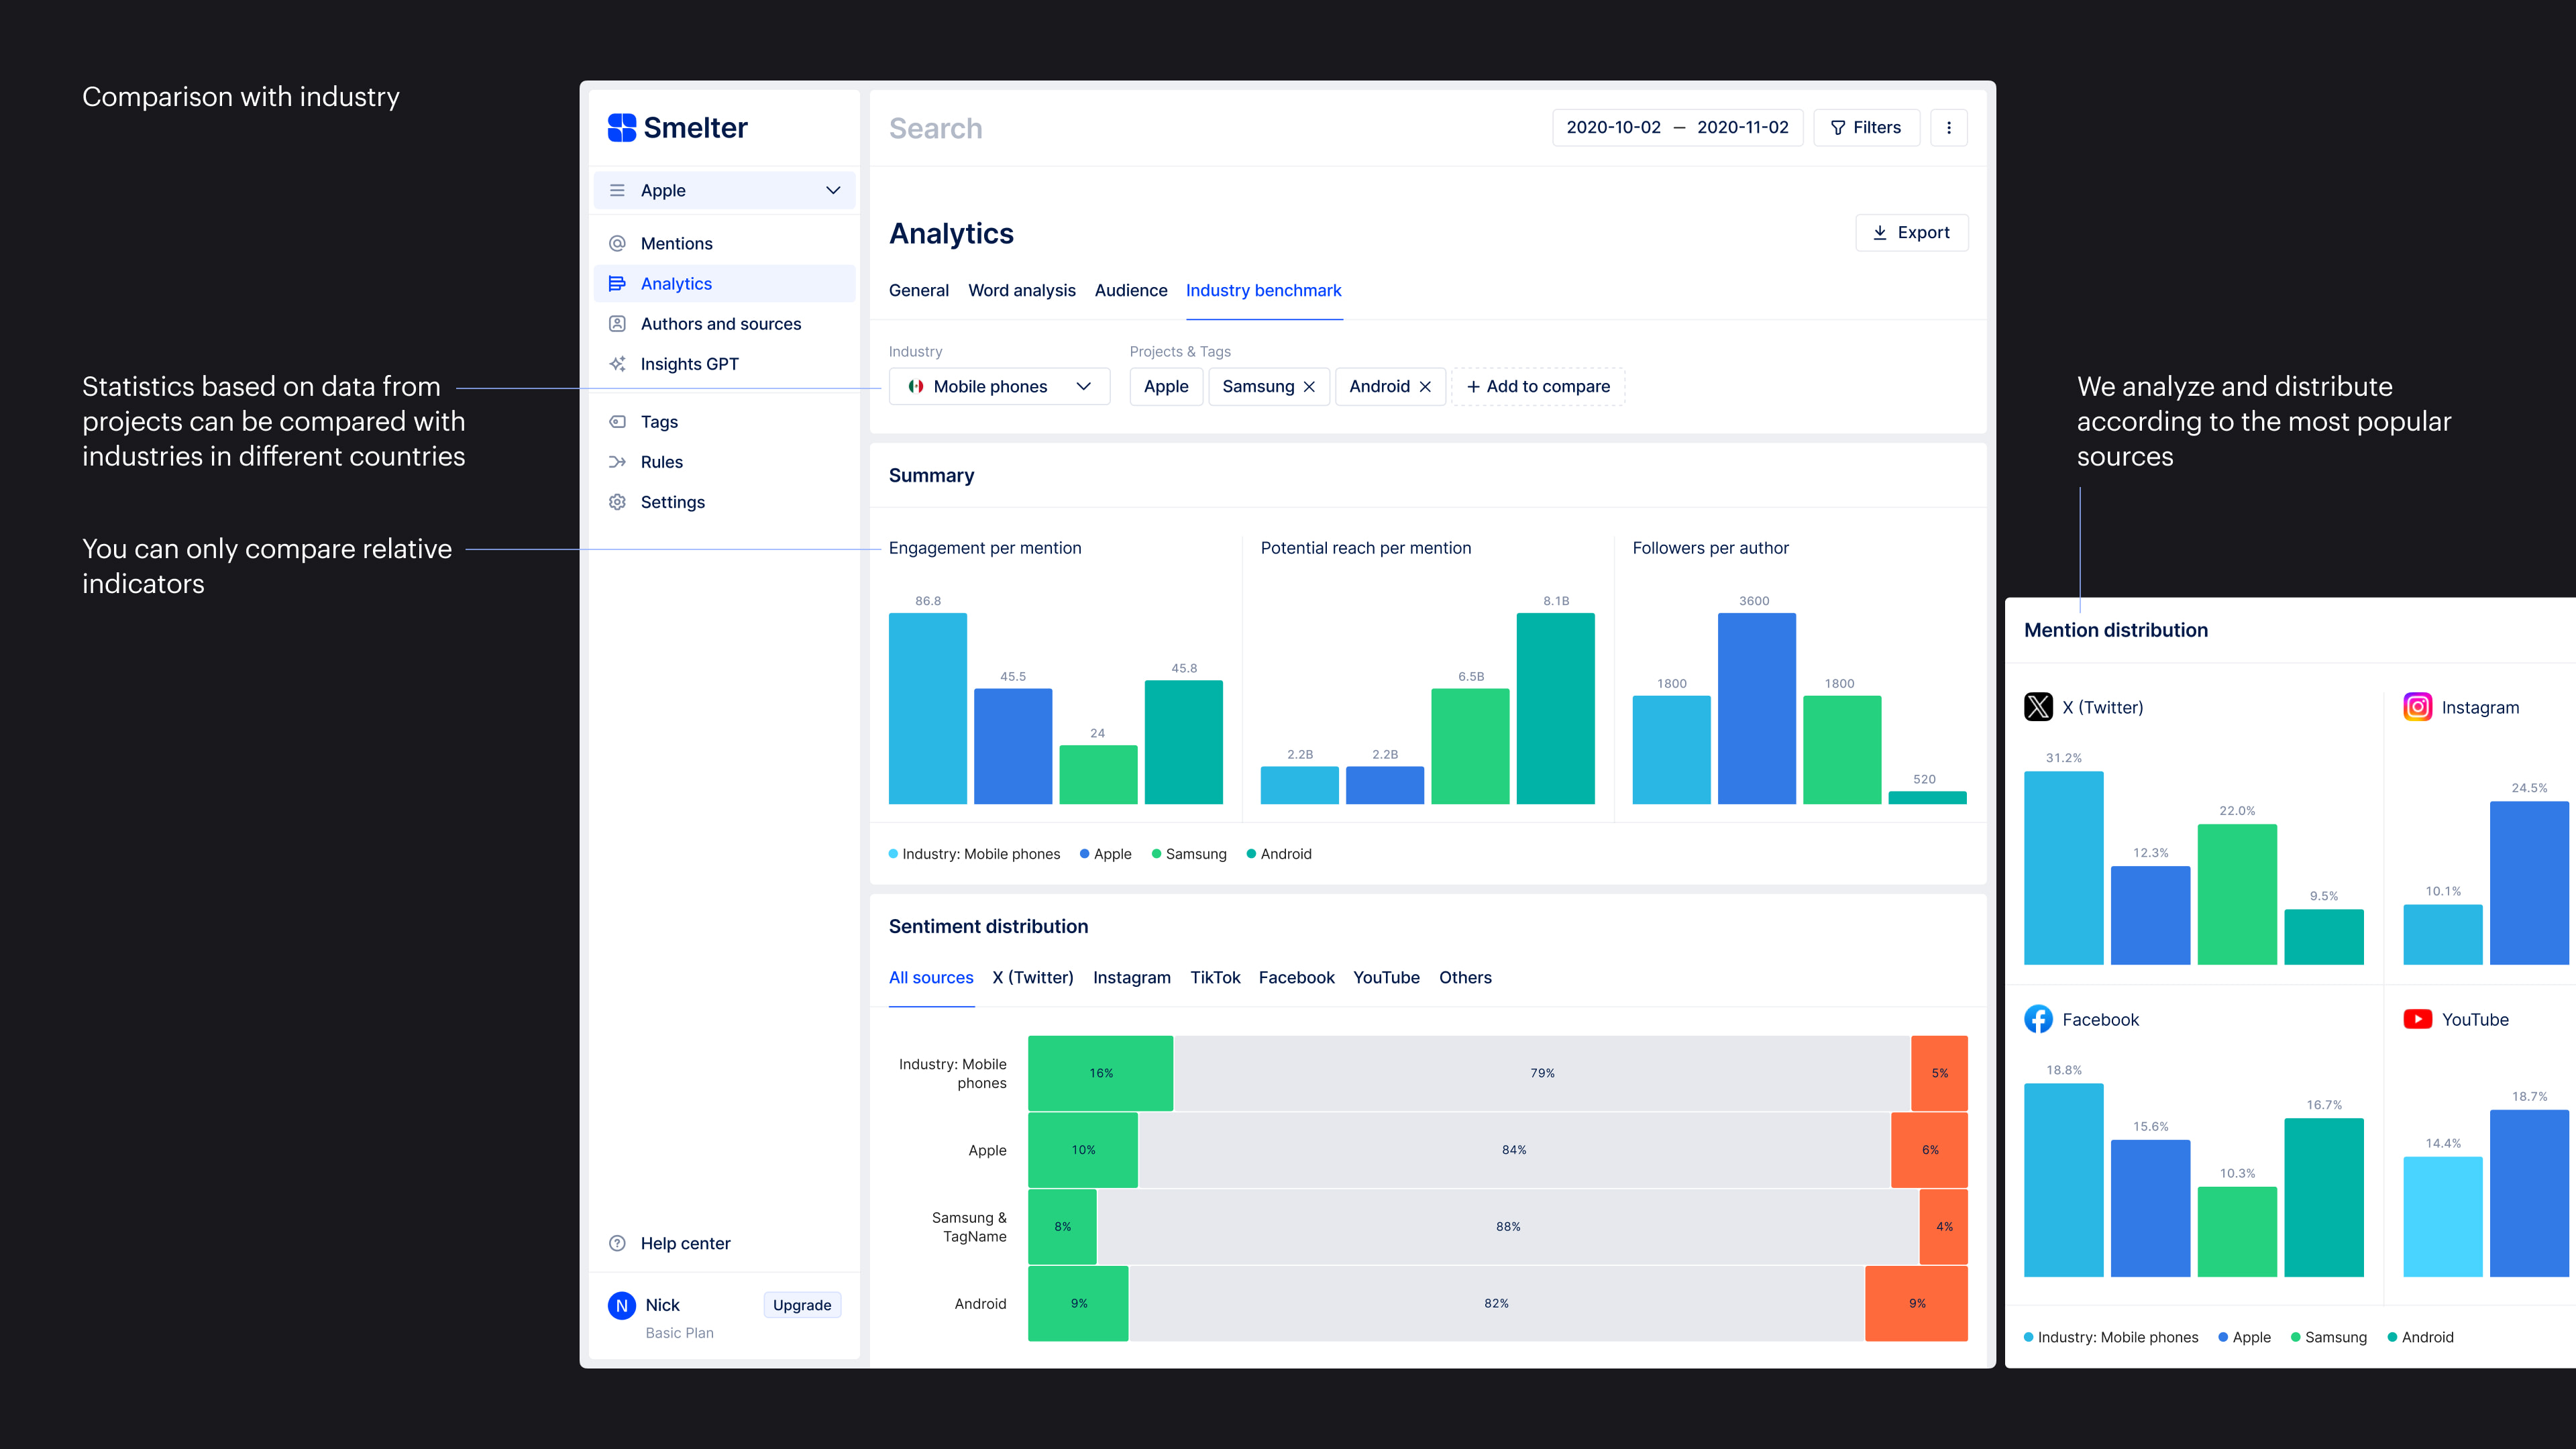
Clients do not always have enough comparisons with competitors, as this is not always representative due to large differences in the size of companies or their targeting.
Solution
Collect data on a large number of companies in the industry and add the ability to compare yourself and your competitors with an industry benchmark.
Comparison with industry
Problem 2
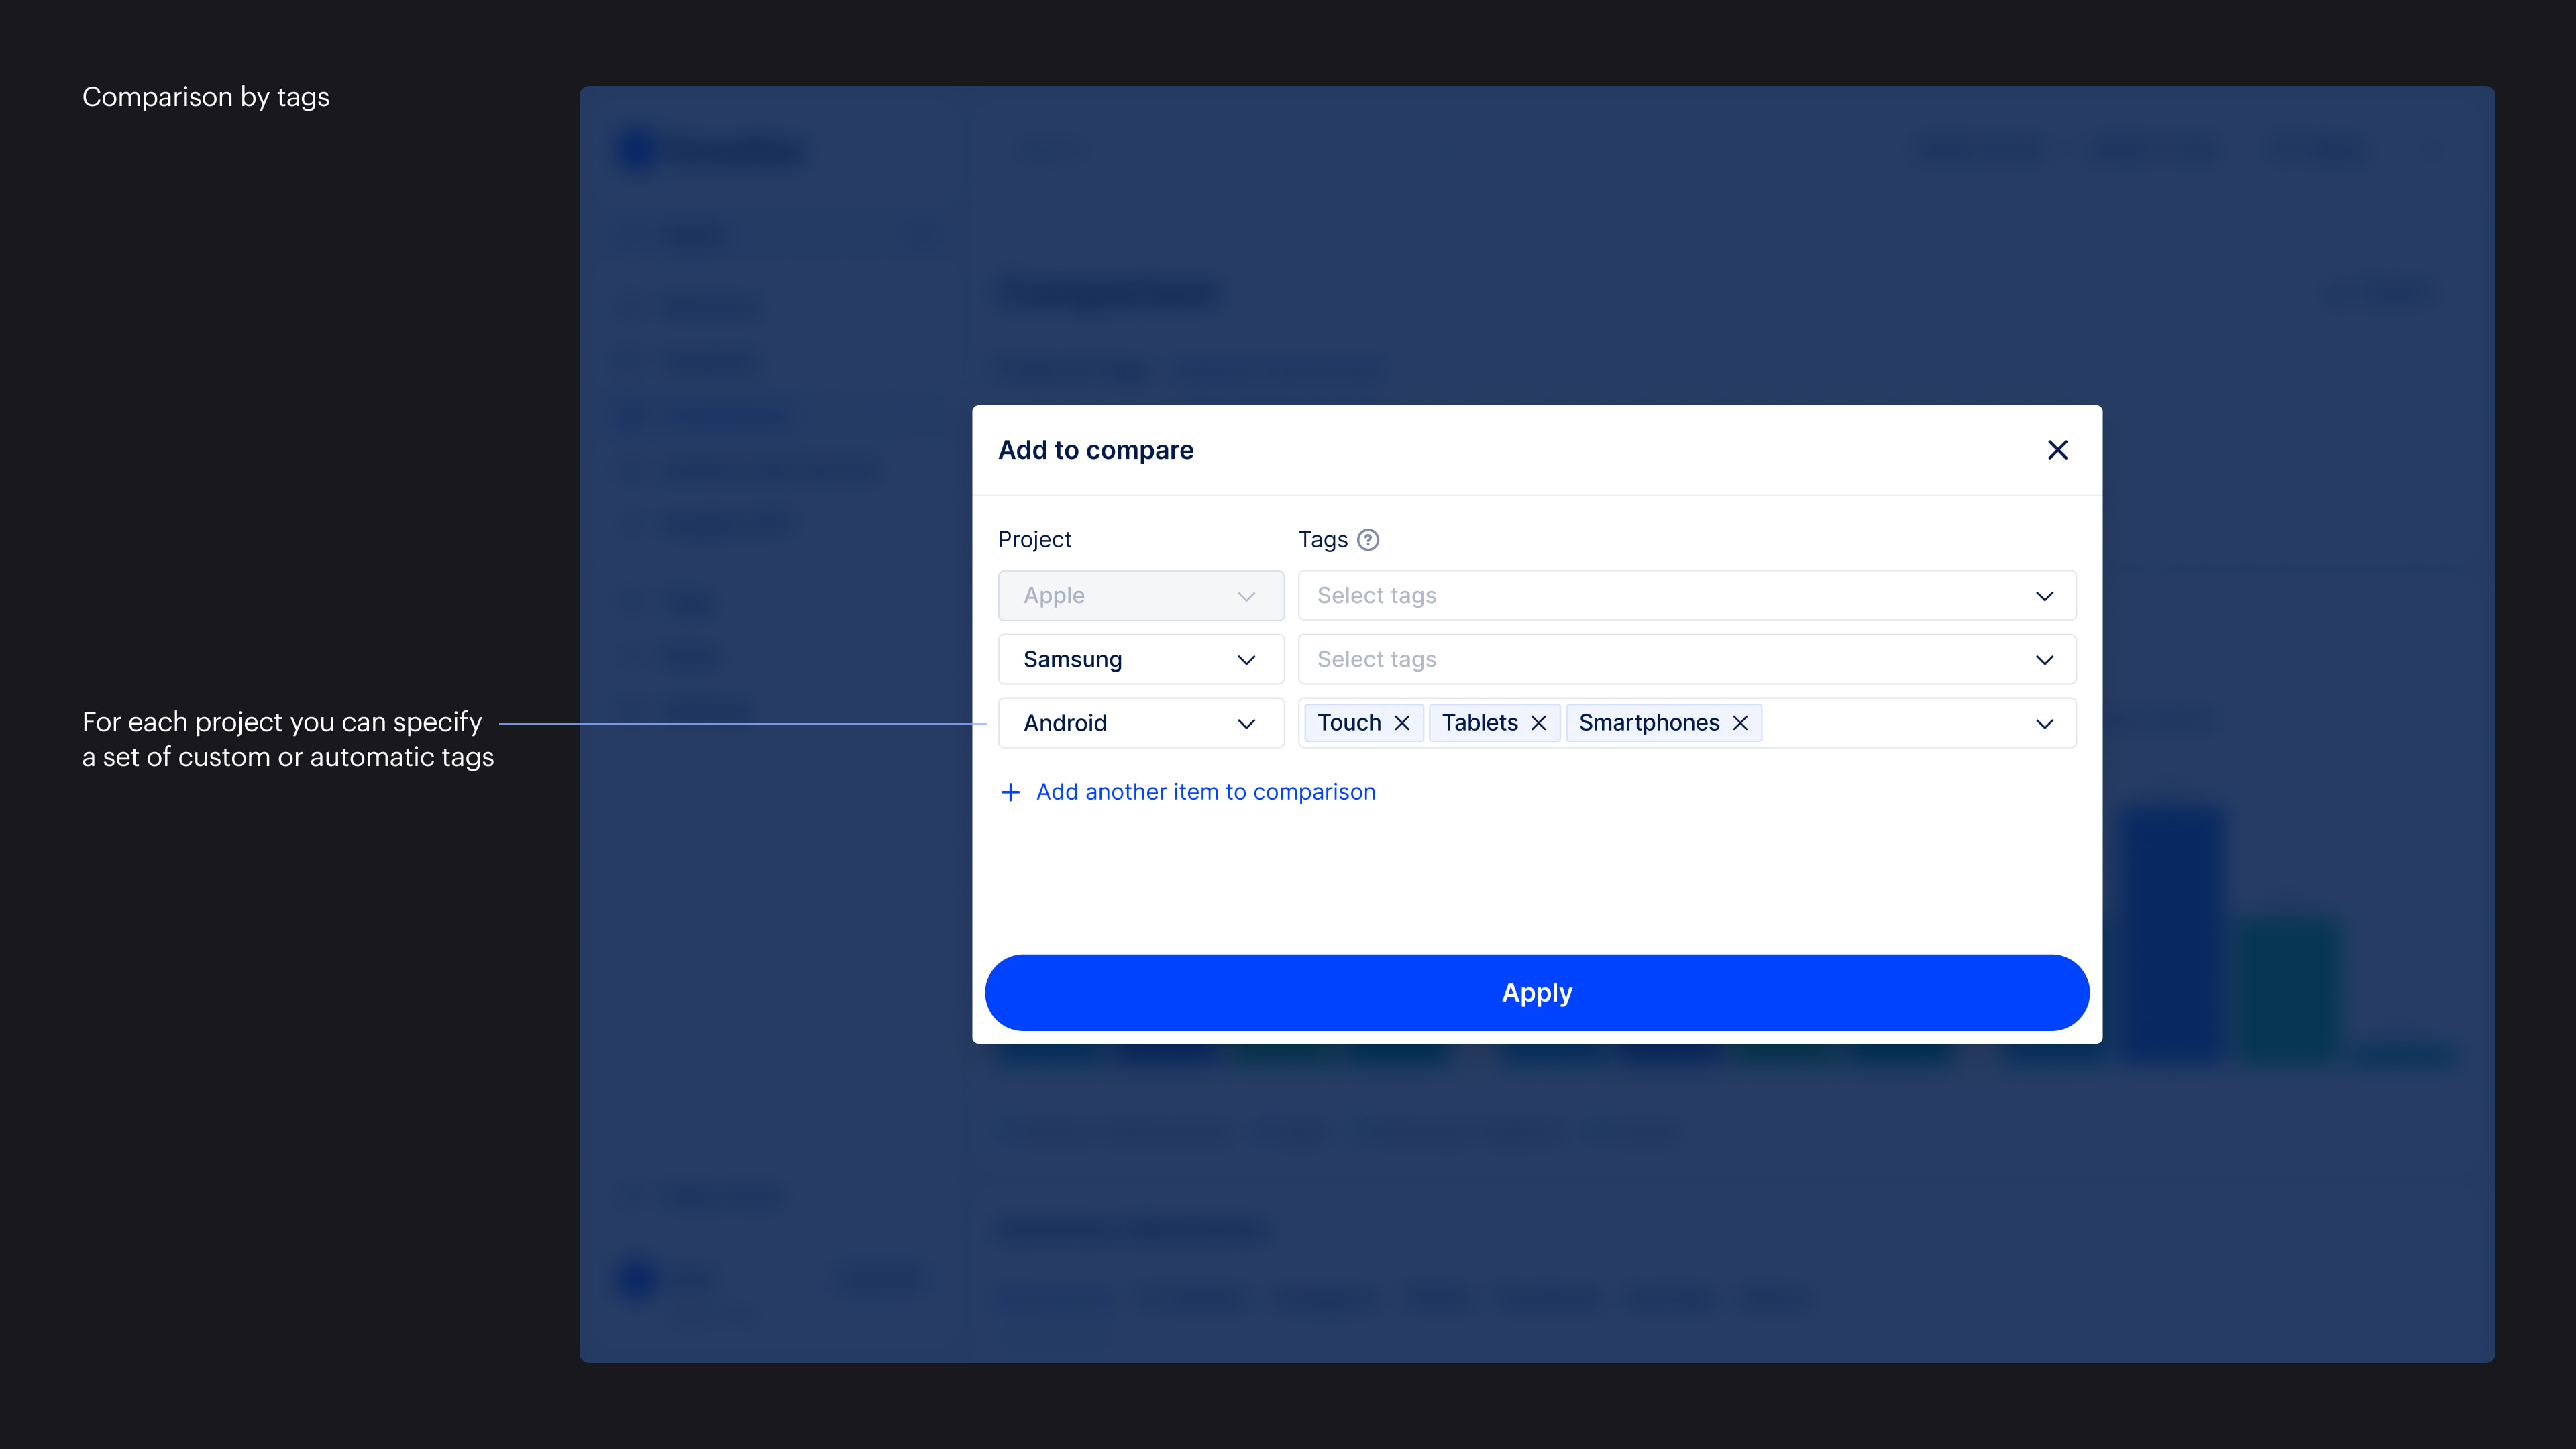
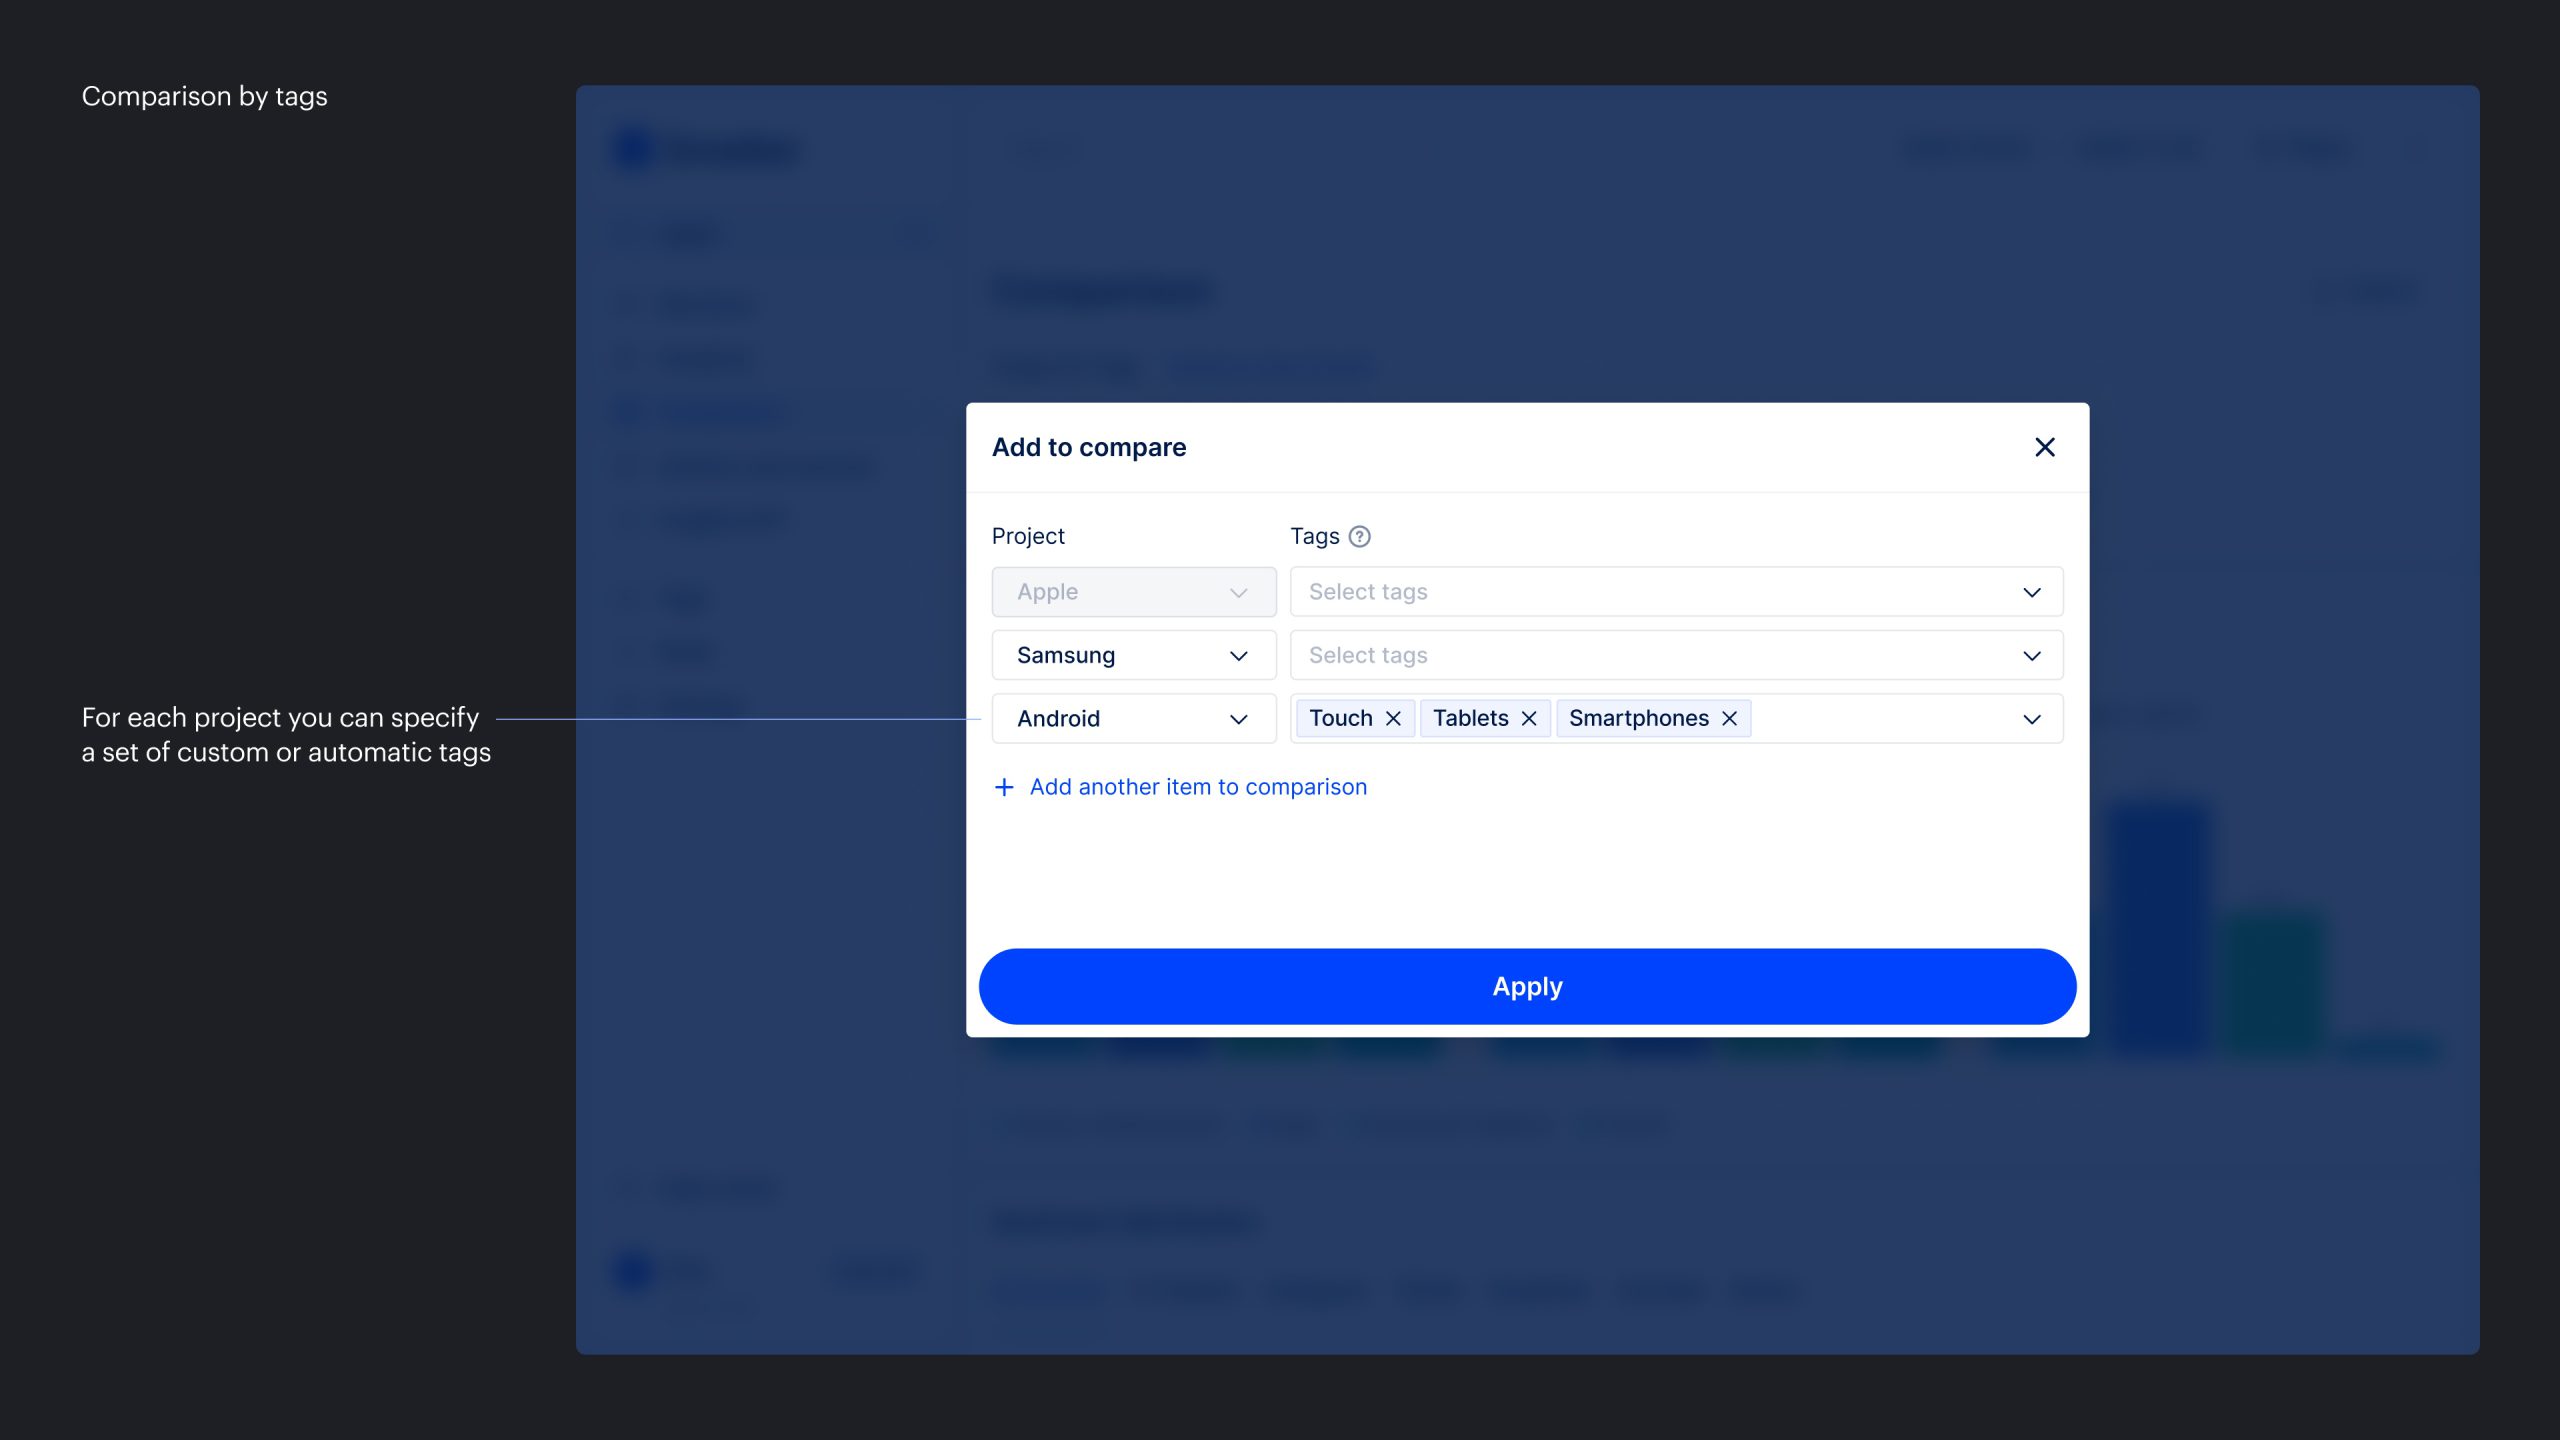
Marketing agencies save resources and can collect data on several clients in one channel by tagging different mentions with different tags. Hence there is a request to compare one or different projects, with a different set of tags.
Solution
It is possible to compare different projects with different sets of tags. In the future, we need to take this into account when developing monetization models.
Comparison by tags
Problem 3
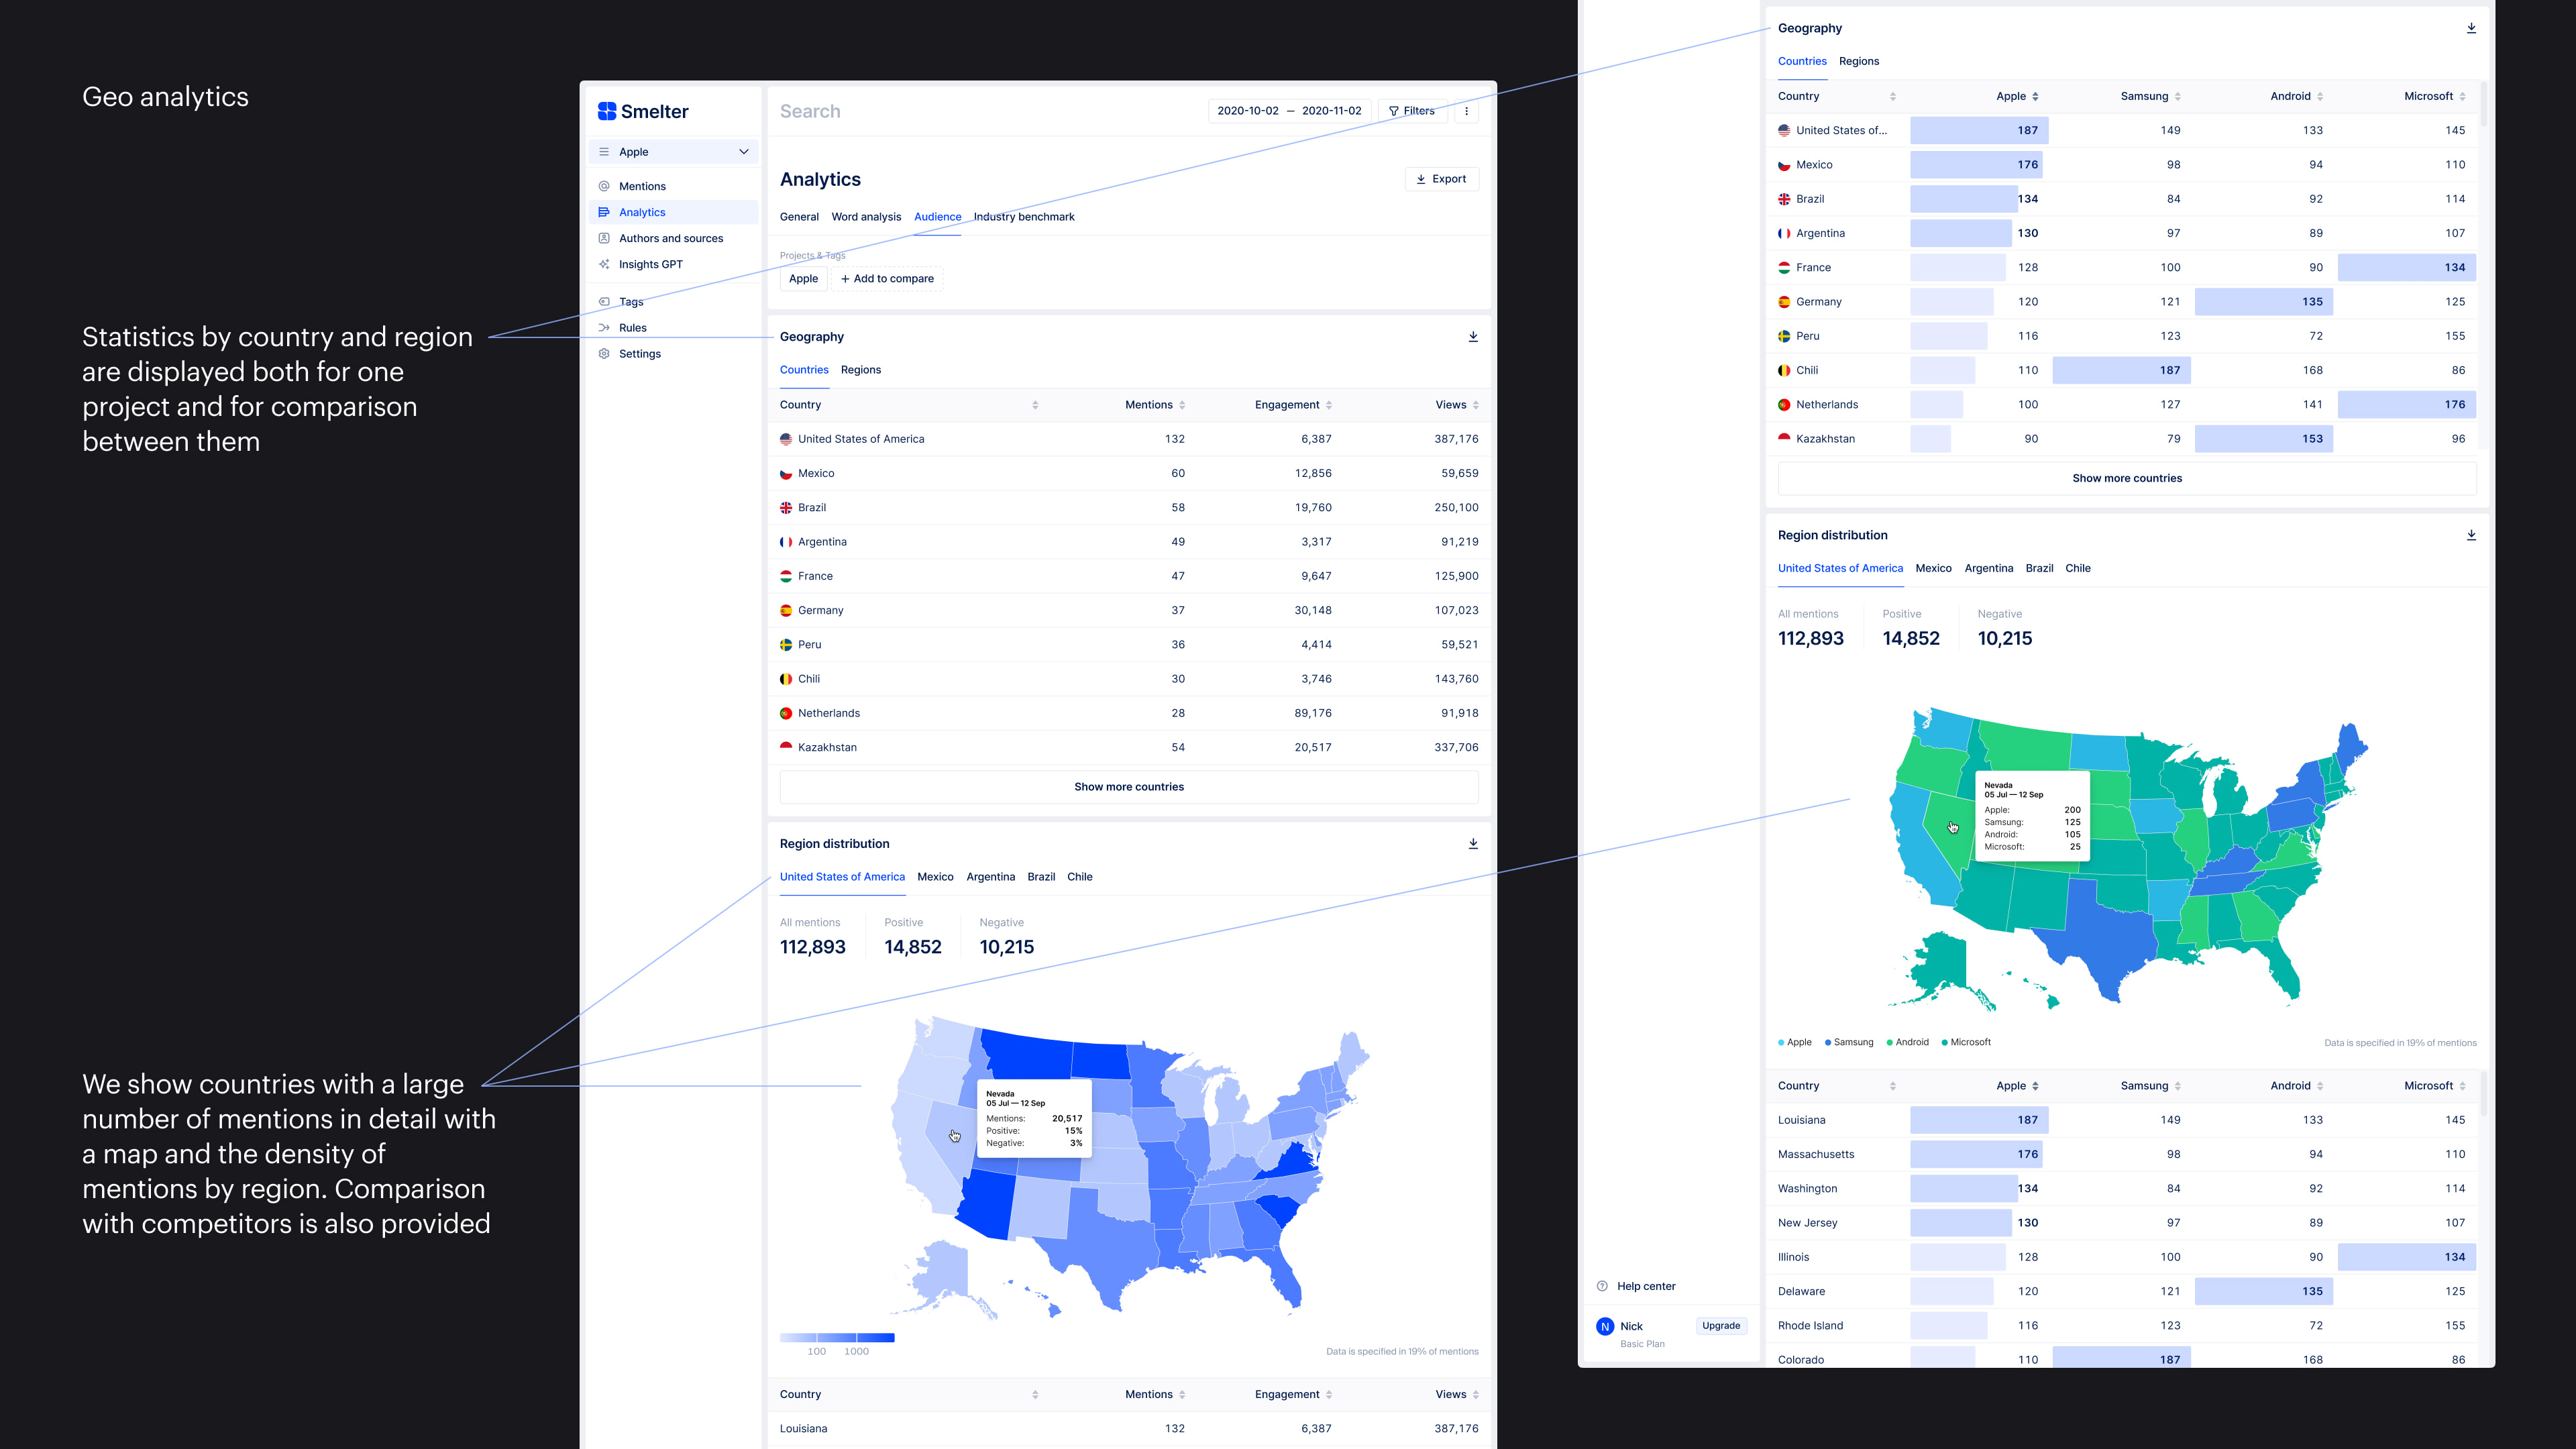
Clients encounter a problem when analyzing geodata by country. The audience in different regions of the country can vary greatly. Based on such data, it is unclear how to personalize marketing.
Solution
Using open data and ML, predict the location of mentions to the region. Provide the opportunity to compare your presence not only across countries but also across regions of selected countries. And also identify regions with a high Share of Voice.
Geo analytics
Case. II
AI platform development
Our development strategy included active development of AI within the product. If analytics and comparison is a transition from raw data to information and knowledge. Connecting AI allows you to move on to insights and specific recommendations for action.
Problem 4
Based on our research, we found that 25% of our clients, among whom the management segment that is important to us (once every 3-6 months), conduct a SWOT analysis while developing a marketing strategy. Manual analysis is not easy and takes time.
Solution
Implement the generation of SWOT analysis based on mentions of your brand and the competitor’s brand
Problem 5
After interviewing our clients, we learned that one of the markups they constantly use is advertising and WOM markup: opinions, and recommendations. Doing this manually takes a long time. Also, for this, you need to read every mention.
Solution
Automate the categorization and tagging of mentions, as well as tagging and filtering by these categories in the interface
Problem 6
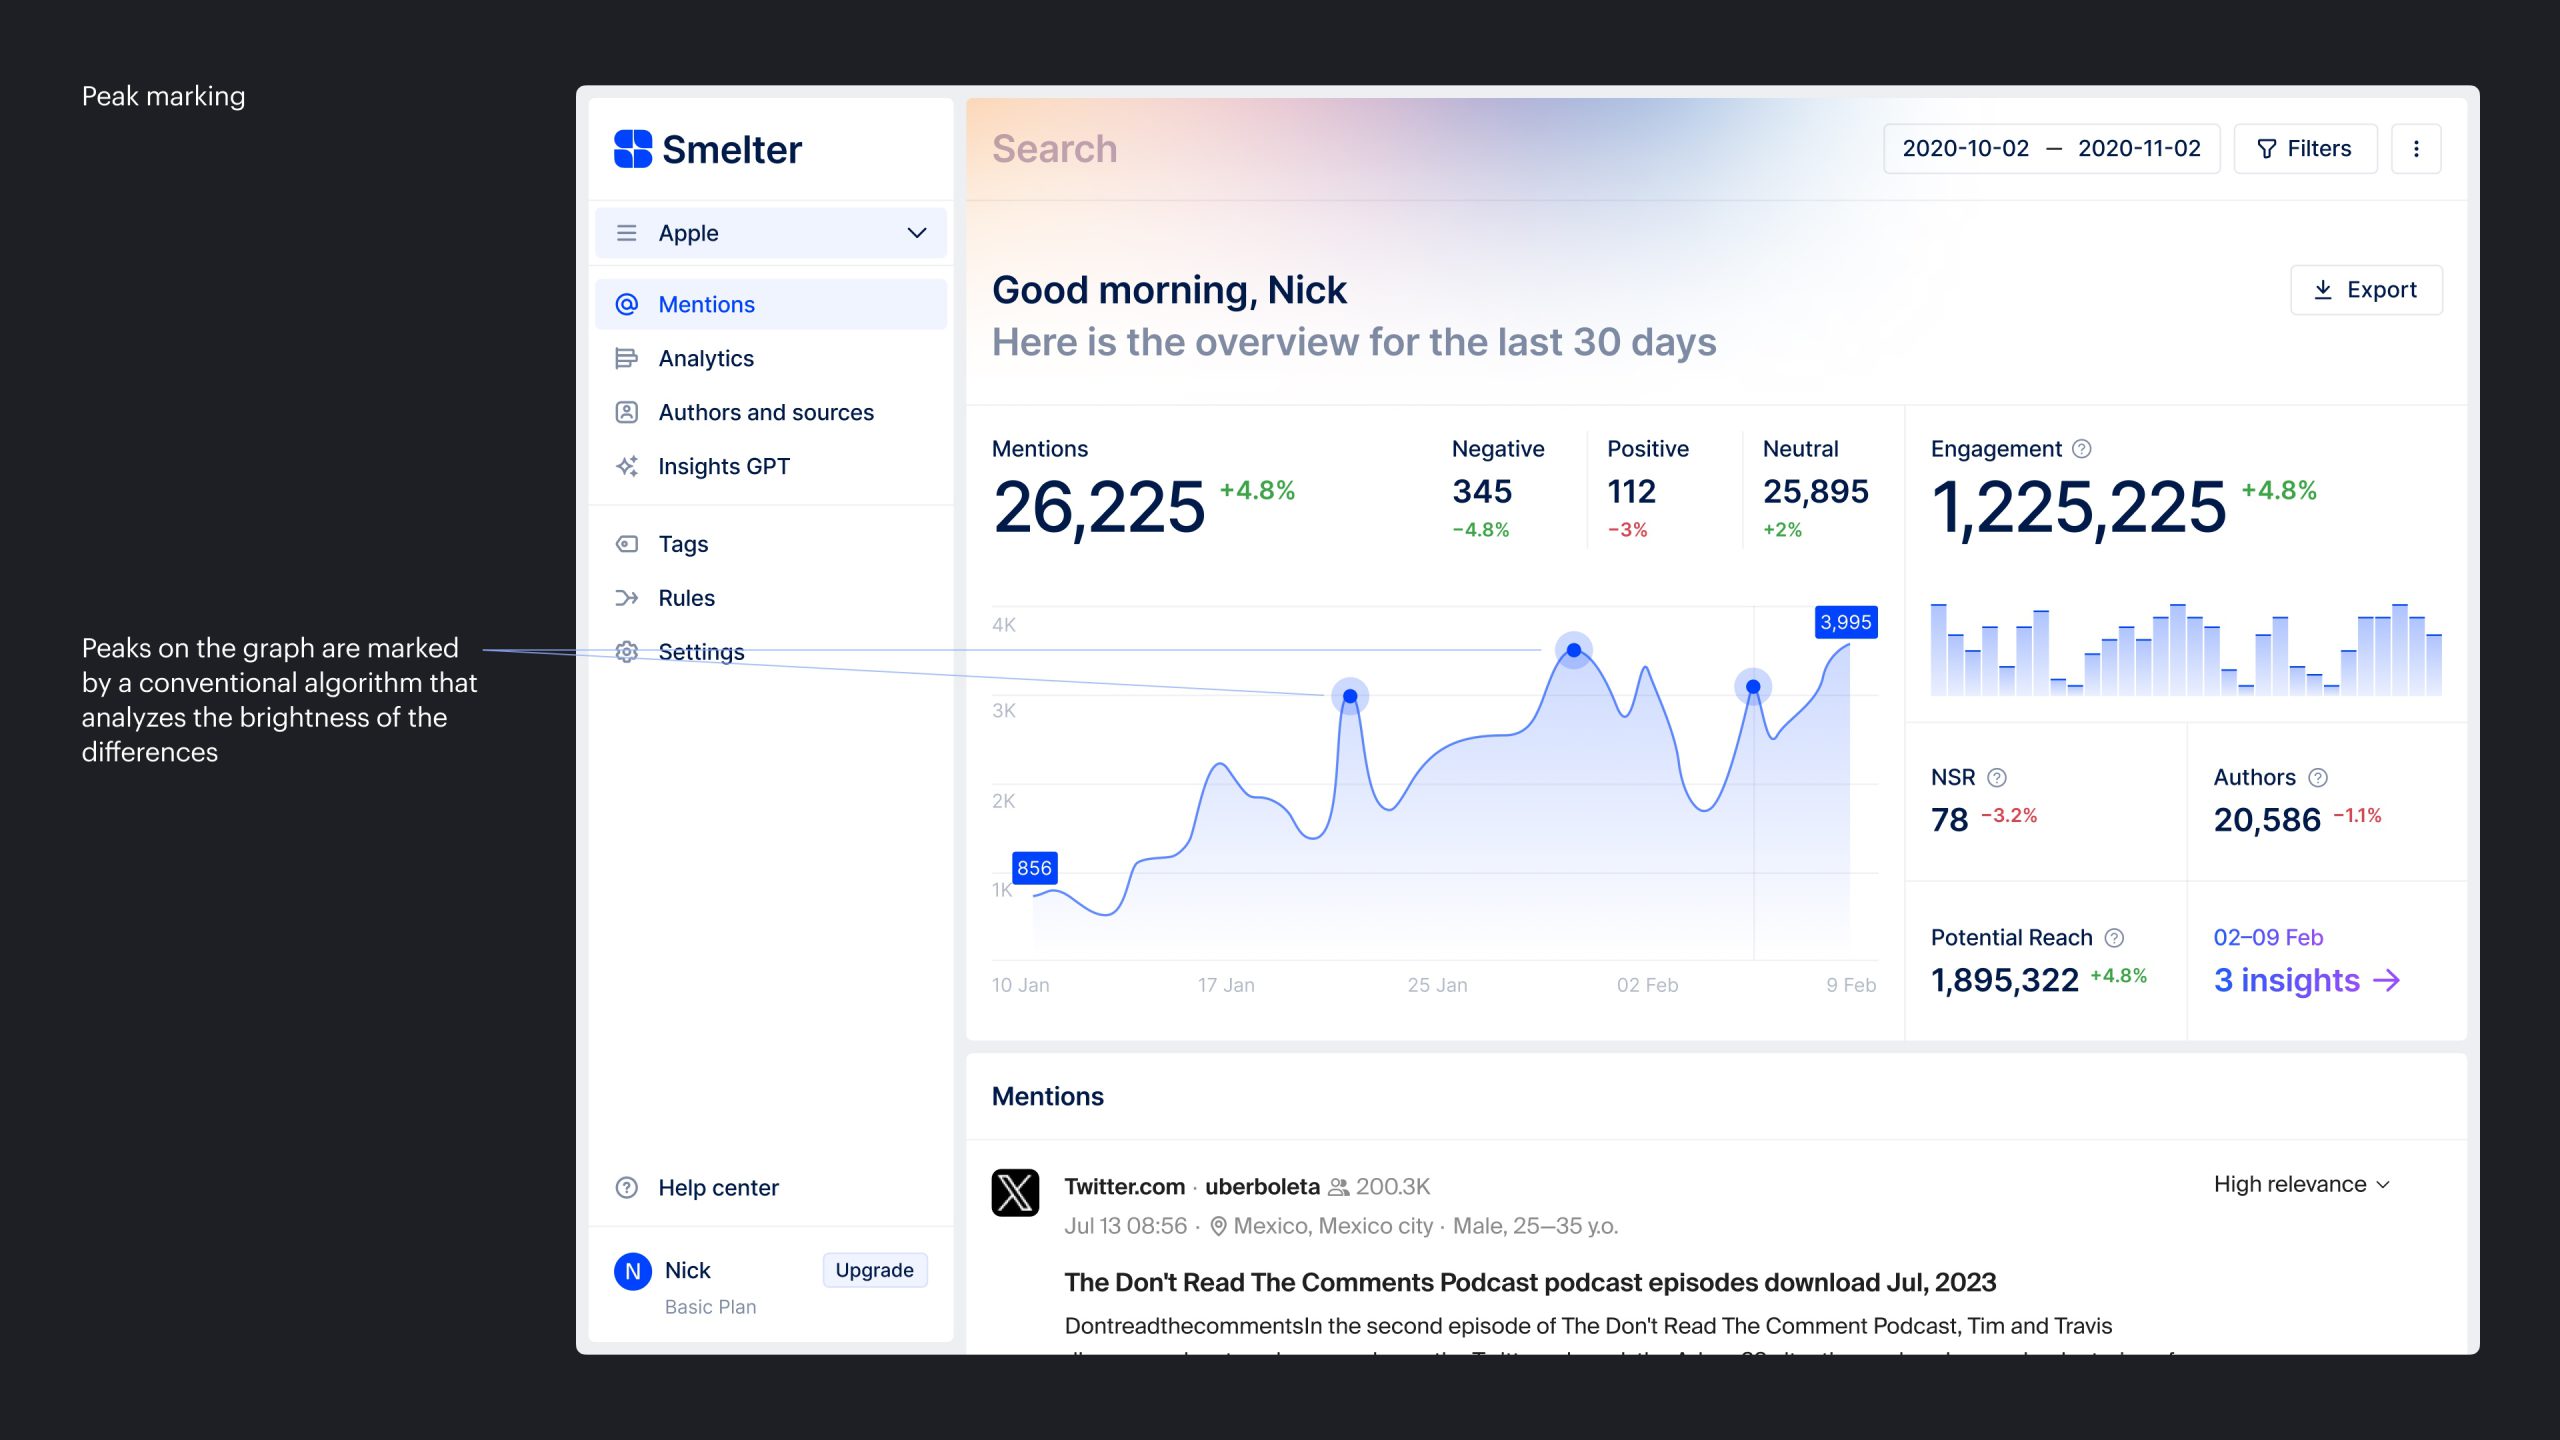
During a meetup with experts, we noticed that most experts were interested in anomalies in the graph — especially spikes in mentions, engagement, and other metrics. The main interest is to find out what happened there, what was discussed, and what caused a resonance.
Solution
Automatically mark peaks on charts, and also make it possible, using AI, to summarize mentions for any selected day/period (including analysis of peaks)
Problem 7
Communicating with industry experts, we found out that the most important task of an analyst in marketing is to generate insights and hypotheses based on the data received. As a rule, analysts learn this for at least 1.5–2 years.
We have also repeatedly received complaints from users that introducing new tools into a flow is always a pain since the tools are complex, and contain a lot of data, which is sometimes difficult to navigate and takes some getting used to.
Solution
Create a ChatGPT-based bot in the product so that data, explanations, and ideas can be requested via text in chat.
Case. III
Crisis management
One of the important tasks for which Social listening tools are used is crisis management. Simply put, this is an opportunity to learn about a problem or opportunity before anyone else to proactively respond to it.
Problem 8
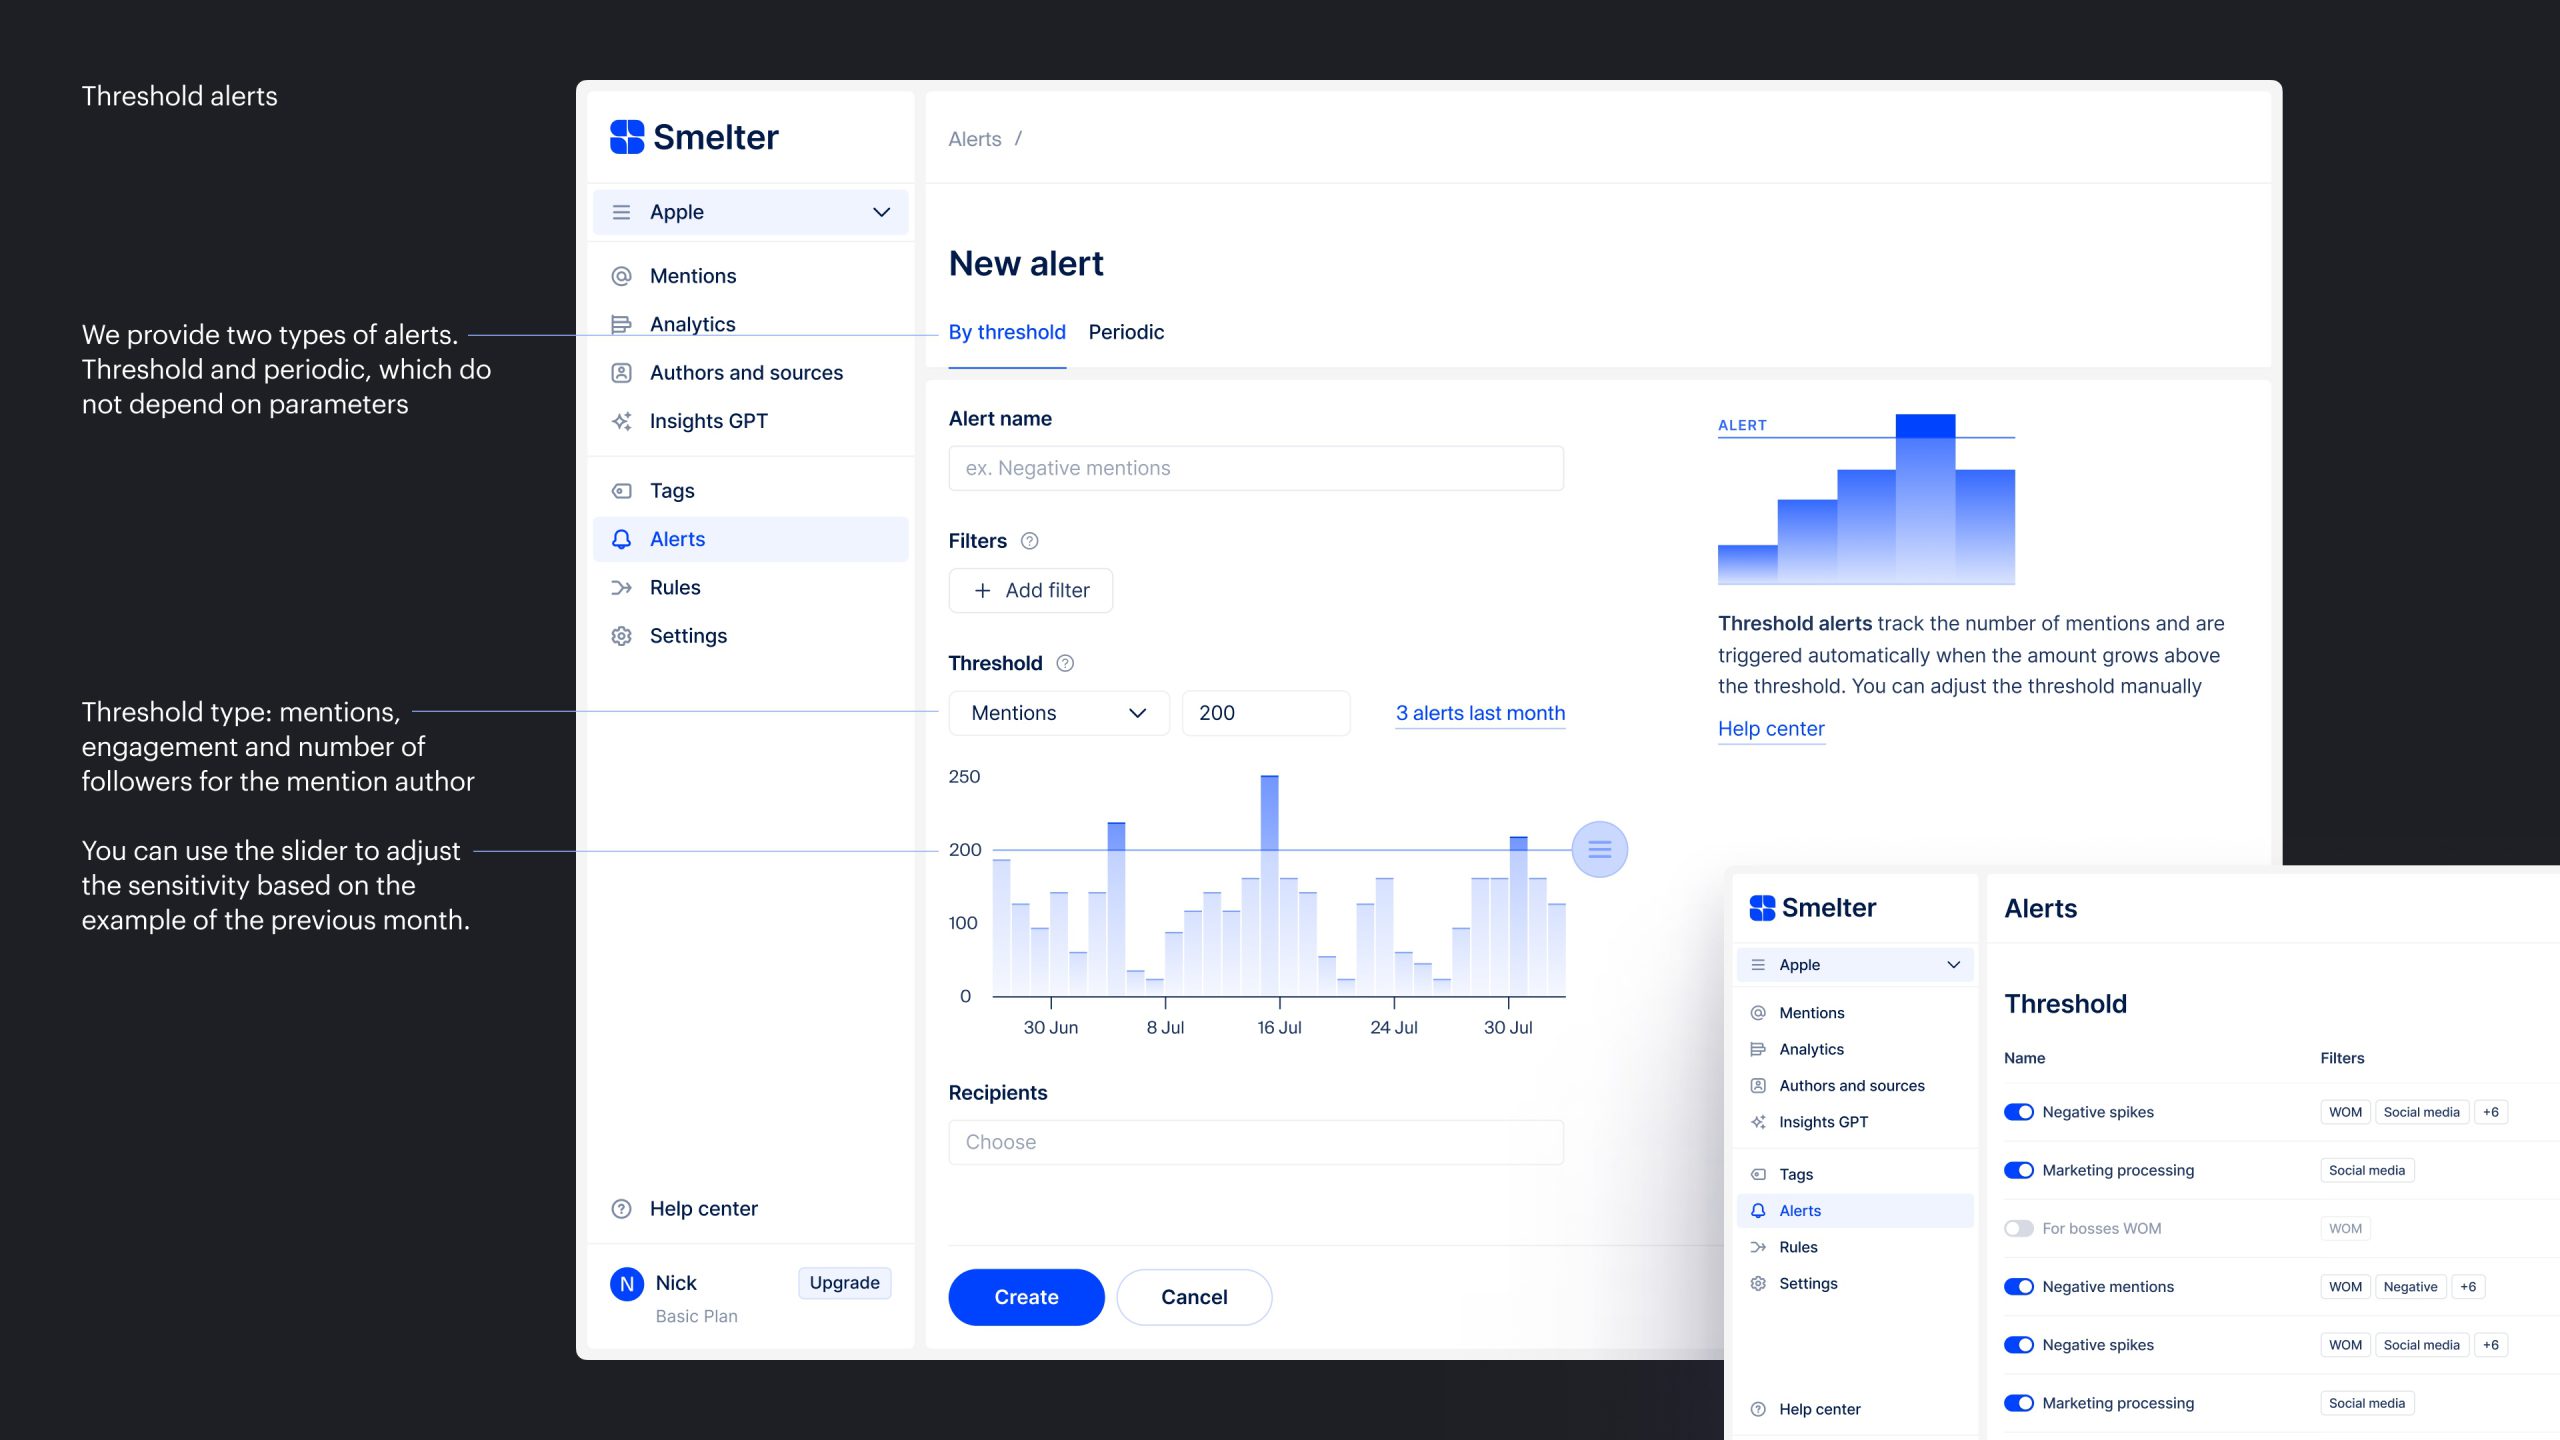
About 10% of our clients are forced to read and analyze all mentions manually in order not to miss a crisis. PR agencies and managers are especially concerned about this.
This is long, inconvenient, and on a large scale, completely impossible.
Solution
Add threshold alerts that will be sent when a certain number of mentions, and engagements per day is reached, or when an author with a large number of followers is mentioned.
In general, we see the future of crisis management as turning on one switch, after which the system will be able to analyze the flow of messages for dangers using ML. But for now, we started with manual automation, as it allows for greater configuration flexibility.
Case. IV
UX improvements
In parallel with the development of features critical for a startup, we also sought to make the platform more convenient to compete in the market not only with its data and ML capabilities but also with UX experience. Based on analytics, and feedback from users and experts, we improved the less important parts of the product from a business point of view.
Problem 9
While communicating with experts, we noticed that most often users want to click on some graphs or tables to immediately see mentions of this section.
Solution
Provide the ability to quickly preview menus based on data selected in graphs or tables without losing context.
Problem 10
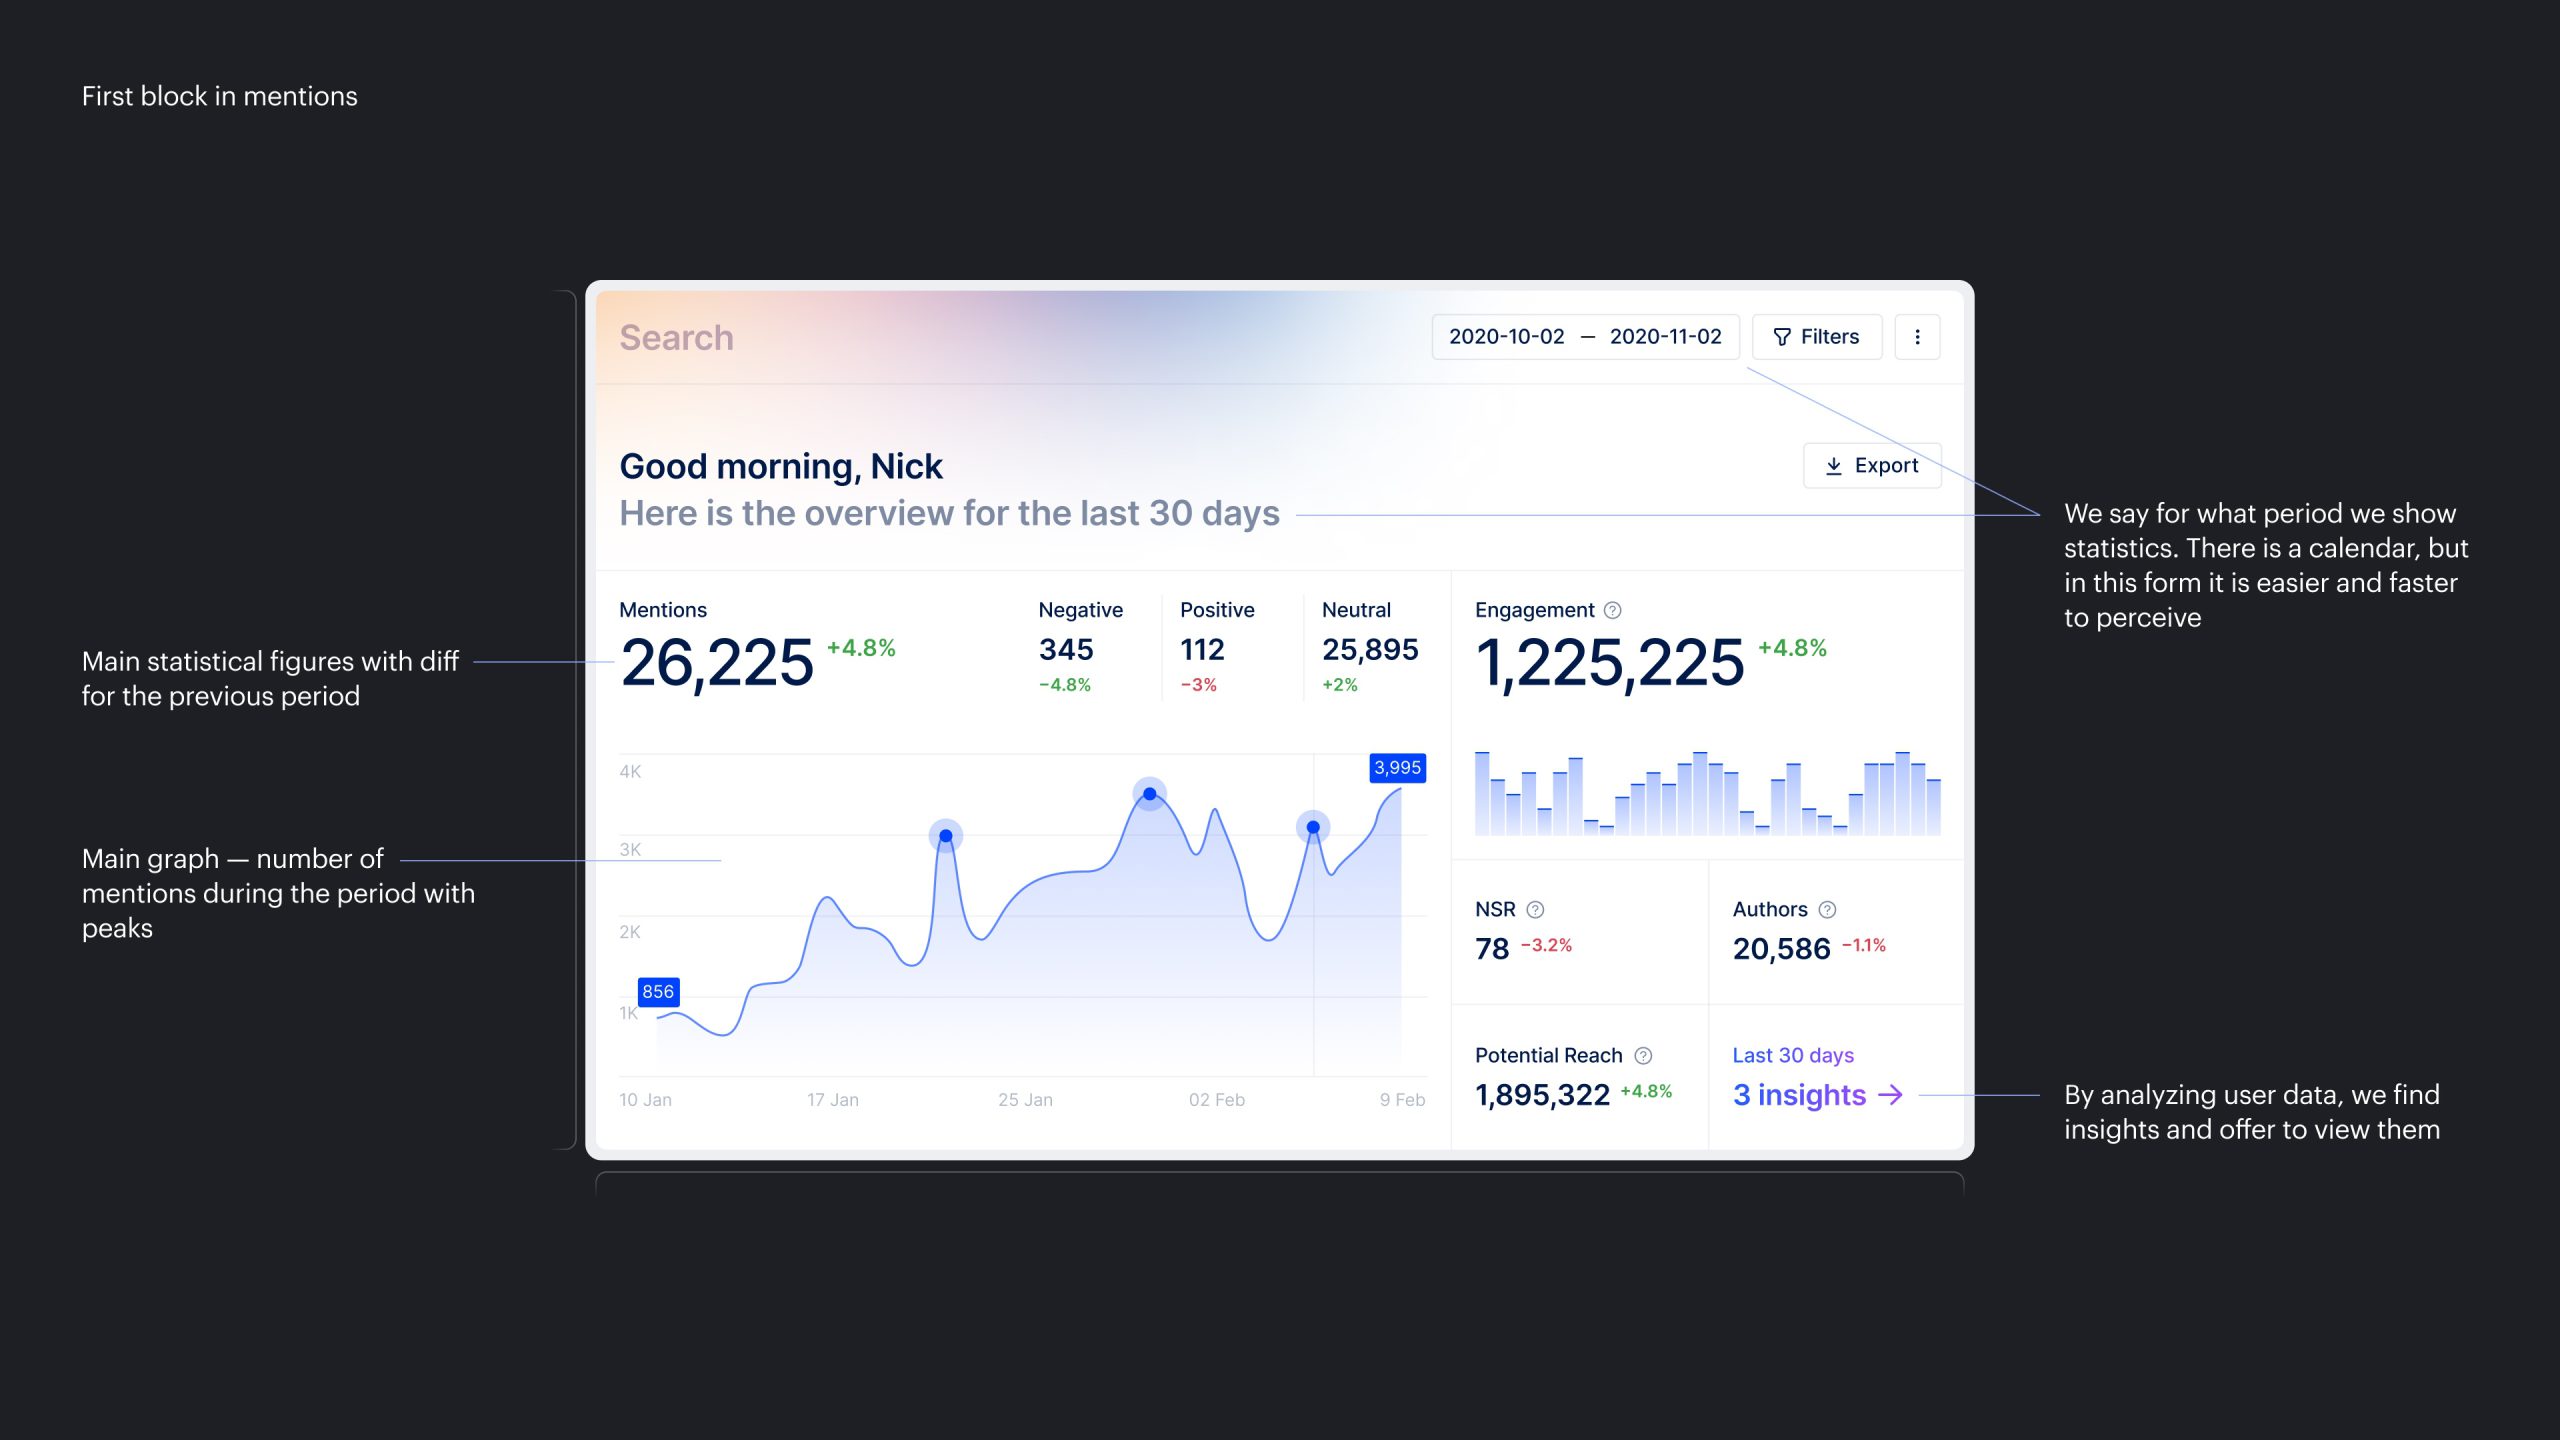
— To see the main metrics that concern users, you need to go to analytics;
— You can understand how many mentions were found only by looking at the legend under the mentions graph;
— The mentions page does not look very good visually, although it is the first thing the user sees in the product.
Solution
— Show basic metrics, including the number of mentions in numbers at once, with a difference by period;
— Visually make the block more compact, information-rich, useful, and interesting to look at.
Case. V
Product communication
When I first joined the team, I immediately noticed that despite the intensive development of the product, practically no attention was paid to communication with the user. I decided to start small and launched a monthly newsletter with basic updates.
During the first letters, I fine-tuned the process, found those responsible for each section, and took on most of the process from the design and meaning to the layout of the letters. Now I am leading this project together with the responsible marketing manager.
We also immediately began adding communication elements inside the product to highlight new important features. One of the next steps we plan to improve onboarding into the product for new customers.
Problem 11
Communication with the user about new features is not carried out either inside or outside the product.
Solution
— Start regular newsletters;
— Think through features + simultaneous onboarding and communication about features in the product (tours and tooltips).
Case. VI
Improving the sales process
In the last six months, we began to notice a problem with the conversion at the point from SQL lead to Customer. To solve the problem, the workload on the sales team was reduced and additional qualification parameters were added. But besides this, we decided to slightly change the demo format.
Problem 12
The current sales presentation format contains several problems:
— Bad product intro;
— It is difficult to convey information about the price, and we cannot yet publish the tariff schedule;
— The product demo is carried out using the example of a new client channel, which is why it is not always possible to show the advantages of the platform;
— It is difficult to track and control the preparation of a sales manager for a demo with a client.
Solution
Create a presentation that the sales team will use during the demo
— Show Smelter as a product and as a company;
— Add a price slide;
— Prepare additional slides to highlight the benefits of the product using the example of a user channel.
We made a presentation that the sales team will prepare to show to the client, as well as sections for this presentation that, in our opinion, will help sell the product. In addition to the presentation, I also made small guides that helped sales people put together a presentation on their own in an acceptable form in terms of design.
Case. VII
Prioritization
Obviously, for a startup, one of the most difficult questions is not how to do it, but what to do and in what order. We also faced this issue.
Problem 13
The ICE prioritization framework is unfortunately very abstract:
— Difficult to define impact;
— Difficult to define confidence.
This causes a lot of controversy.
Solution
Based on the ICE methodology, develop your system that will suit the product at its current stage.
— Assessment;
— Feedback from clients and experts;
— Team believe.
The final framework was based on several parameters:
— User feedback;
— Feedback from experts;
— UX research;
— The team believes in the feature;
— Efforts.
In total, these indicators gave a final score, which prioritized the features on the list. In essence, this is the same ICE framework, but in which the parameters are more detailed to suit the current situation in the company.
Case. VIII
Communication Design
In communications, I created a brand book, established the processing of orders from marketing with the help of the internal Yandex team, created a design for an event, a new identity for advertising, and an industry report.
Problem 14
Smelter needs to scale and increase the speed of communication design development.
Solution
Develop a brand book to speed up the process of ordering a design in the internal Yandex agency and make it easier to control design quality.
Outro
Results
Over the past 9 months, we have increased MRR, reduced the cost of customer acquisition, and increased LTV.
We continue to move towards a stable product model and a point from which we can begin to scale.
Drop me a line
skorobogatkonn@gmail.com


